The following lists the order in which the rules/policies/ACLs (whatever you may call it) are enforced in Check Point R75:-
I was just about to put some FW Monitor templates on my blog for quick reference when I need to troubleshoot some issues in Check Point but I thought it would be a nice thing to explain this first (for myself too, as I keep forgetting this stuff :D).
When traffic flows through a Check Point Security Gateway (look here if you want to know about the architecture) it has to cross a series of inspection points. This post tries to explain what those inspection points are and how to troubleshoot traffic flows based on the inspection points. The next post will show how to use the FW Monitor.
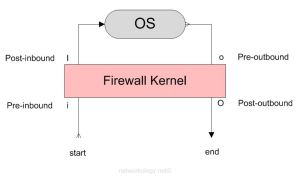
Inspection Points (in the order they are passed):
| 1st | i – Pre-inbound | rule/inspection is applied at this point |
| 2nd | I – Post-inbound | after being permitted by the rule/inspections |
| 3rd | o – Pre-outbound | route look up has been performed to determine the egress interface |
| 4th | O – Post-outbound | after egressing the correct firewall interface based on route lookup |
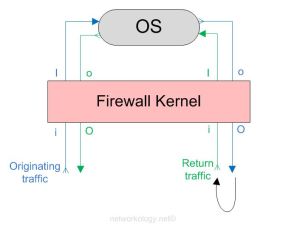
The above image shows how a firewall kernel protects the Check Point OS. The start and end depict the start and end of the originating traffic flow. The return traffic too goes through the same inspection points. The below diagram shows how a complete two-way traffic is treated by the inspection points.
For a complete two-way communicating traffic you should see 8 logs (also depends if you do want to see 8 or less)
So looking at the above diagram you see that a complete traffic flow of a two-way communication goes through 8 inspection points;
Originating traffic from A to B = 4 logs of iIoO
and the return traffic from B to A = 4 logs of iIoO
and the return traffic from B to A = 4 logs of iIoO
I you don’t want to see what is going on at the inspection points ‘I’ and ‘o’ then you only grep ‘i’ and ‘O’ and get 4 logs in total for a complete two-way traffic;
Originating traffic from A to B = 2 logs of iO
and the return traffic from B to A = 2 logs of iO
and the return traffic from B to A = 2 logs of iO
Sometimes you won’t see 8 logs for a complete two-way communicating traffic and will only see 4 logs
If you are grepping iIoO in your captures and you still don’t see a ‘I’ or ‘o’, but you do see a ‘i’ and an ‘O’, then most likely SecureXL is fast switching/accelerating the traffic because the initial packets of that flow were already allowed.
You can disable SecureXL while setting captures if you want to inspect them at that granularity (i.e ‘I’ and ‘o’). In my experience, disabling SecureXL hasn’t been a problem* and I haven’t seen any performance impact as such.
Right before the capture, turn off SecureXL on the gateway:
fwaccel off
Immediately after the capture, turn on SecureXL on the gateway:
fwaccel on
To turn on fw accel on multiple VSXs at once:
fwaccel on -a
*Do it at your own risk, I do not take any responsibility for anything going wrong with this as it does affect the live traffic immediately. Read the site disclaimer. :)
Troubleshooting the inspection points
Troubleshooting ‘i’ – When you don’t see any traffic on the ‘i’ inspection point:-
Traffic isn’t hitting your firewall. You won’t get back any captures and the console will just be a black blank screen (or any other background color you use on your terminal :D).
Troubleshooting ‘I’ – When you see traffic hitting the ‘i’ inspection point but don’t see it hitting ‘I’:-
The firewall is blocking that ingress traffic either by a rule, improper NAT, IP spoofing, Application Inspection or anything else that you can think of.
Troubleshooting ‘o’ – When you see an ‘i’ and ‘I’ but don’t see an ‘o’:-
I’m not very sure on this but in one case that I observed, there was a route missing for the destination in the routing table, so the route look up failed to determine an egress interface and I didn’t see the traffic hitting ‘o’ and it was stuck at ‘I’.
Troubleshooting ‘O’ – When you see an ‘i’, ‘I’ and ‘o’ but not an ‘O’:-
I too don’t know, please tell me what that would be and I’ll update it here. :) I think it might be some kind of inspection or something. But I’m quite sure it will be a very rare case.
FW Monitor
FW Monitor is the tool that can be used to see your traffic flowing through different inspection points. FW Monitor cannot give you the information what SmartviewTracker/Monitor can, because it is a wire capture. It just tells you what is on the wires and does not look into the rule base to see which policy allowed the traffic and was it NAT’d or not. So the Smartview Tracker and Monitor serves a slightly different purpose than the FW Monitor.
I’m writing a separate post on how to use the FW Monitor at it’s best and in different ways so you can be better at troubleshooting traffic flow issues in Check Point.
___________________________________________________________________________________________________________________________________________________________________________
If you see any mistakes in the post or have any suggestions to add to this post, please feel free to comment. Thank you!

