Interface speed duplex settings are critical to ensure there are not RX/TX packet drops
ethtool -S eth1-03
fw ctl pstat
expertmode > cpinf -d -Z
Hardware diagnostics https://support.checkpoint.com/results/sk/sk97251
[Expert@myfw01]#
hcp -r all --include-wts yes
Test
name
Status
============================================================
APPI
DB status....................................[PASSED]
ARP
Cache Limit...................................[PASSED]
ARP
neighbour table overflow......................[PASSED]
Blocker
handlers check............................[PASSED]
Bond
- Traffic distribution.......................[SKIPPED]
CPview
Diagnostic.................................[INFO]
Check
Point Processes.............................[PASSED]
Cluster...........................................[PASSED]
Connectivity
to UC................................[PASSED]
Core
Dumps........................................[PASSED]
Cpu
spikes........................................[INFO]
Custom
Applications RegEx.........................[ERROR]
Debug
flags - FW..................................[PASSED]
Debug
flags - fwaccel.............................[PASSED]
Disk
Space........................................[PASSED]
Dmesg
analysis....................................[PASSED]
Dynamic
Balancing.................................[PASSED]
Dynamic
Objects Database..........................[PASSED]
FW
Configuration File Sanity......................[PASSED]
FW
Connection balancing...........................[SKIPPED]
FW
and PPACK communication CPAQ failures..........[SKIPPED]
FW
instances drops................................[SKIPPED]
FW
queues utilization.............................[SKIPPED]
File
Descriptors..................................[PASSED]
Fragmentation
rate................................[SKIPPED]
Gaia
DB...........................................[PASSED]
HTTPD
SSL CONF FILE...............................[PASSED]
HTTPS
inspection..................................[PASSED]
Hardware
Compatibility............................[PASSED]
Hardware
validation...............................[PASSED]
Heavy
connections.................................[PASSED]
IO
wait...........................................[SKIPPED]
IPv4
forwarding...................................[PASSED]
Identity
Awareness - Sharing mechanism error......[PASSED]
Identity
Awareness - tables limit.................[PASSED]
Identity
Awareness - tables mismatch..............[PASSED]
Ifconfig
validation...............................[PASSED]
Interface
Errors..................................[PASSED]
Kernel
crash......................................[PASSED]
Local
Logging.....................................[PASSED]
MTU...............................................[PASSED]
Memory
Usage......................................[PASSED]
Multiqueue........................................[SKIPPED]
Network
statistics................................[PASSED]
Penalty
box statistics............................[PASSED]
SIC...............................................[PASSED]
SIM
Configuration File Sanity.....................[PASSED]
SSD
Health........................................[PASSED]
SYSLOG
timestamp..................................[PASSED]
SecureXL
drops....................................[SKIPPED]
SecureXL
status...................................[PASSED]
Soft
lockup.......................................[PASSED]
Software
Version..................................[PASSED]
Static
affinity...................................[PASSED]
System
stressed...................................[PASSED]
Template
efficiency...............................[PASSED]
Traffic
distribution..............................[PASSED]
Transceivers
Support..............................[PASSED]
URL
filtering.....................................[PASSED]
User
space processes affinity check...............[PASSED]
User
space processes utilization..................[PASSED]
VPN
test..........................................[PASSED]
Zombie
processes..................................[PASSED]
Generating
Topology...............................[Done]
Generating
Story..................................[Done]
Generating
Charts.................................[Done]
To view full report on this machine, run "hcp
--show-last-full"
To view report as html file. Copy
/var/log/hcp/last/hcp_report_myfw_08_06_23_14_20.tar.gz to your desktop,
extract the tar content and open the index.html via your web browser
[Expert@myfw:0]#
set interface eth1-04
rx-ringsize 1024 (2048)
set interface eth1-04 tx-ringsize 1024 or (2048)
save config
Typical Gaia Interface configuration
set interface eth1-04 comments "Outside Internet"
set interface eth1-04 link-speed 10G/full
set interface eth1-04 state on
set interface eth1-04 auto-negotiation on
set interface eth1-04 rx-ringsize 1024
set interface eth1-04 ipv4-address 127..21.183.11 mask-length 25
· NIC ring buffers getting full and unable to cope-up with incoming bursts of traffic
· CPU receiving NIC interrupts is very busy and unable to process
· some cable/hardware/duplex issues
· some bug in NIC driver
Adjust rx/tx values of you are seeing drops with netstat -I
Kernel Interface table
Iface MTU Met RX-OK RX-ERR RX-DRP RX-OVR TX-OK TX-ERR TX-DRP TX-OVR Flg
Mgmt 1500 0 175511 0 0 0 192 0 0 0 BMRU
Sync 1500 0 260036220 0 0 0 270025517 0 0 0 BMRU
eth3-01 1500 0 459958119 0 123700 0 739744482 0 0 0 BMRU
eth3-04 1500 0 1587590363 0 4380 0 1473928991 0 0 0 BMRU
lo 65536 0 21328349 0 0 0 21328349 0 0 0 ALdORU
[Expert@my-vpn-fw101:0]#
set interface eth1-01 rx-ringsize 1024
set interface eth1-01 tx-ringsize 1024
set interface eth1-04 rx-ringsize 2048
set interface eth1-04 tx-ringsize 2048
Ring parameters for eth3-01:
Pre-set maximums:
RX: 4096
RX Mini: 0
RX Jumbo: 0
TX: 4096
Current hardware settings:
RX: 512
RX Mini: 0
RX Jumbo: 0
TX: 1024
[Expert@my-vpn-101:0]#
Number of RX packet drops on interfaces increases on a Security Gateway R80.30 and higher with Gaia kernel 3.10
Symptoms
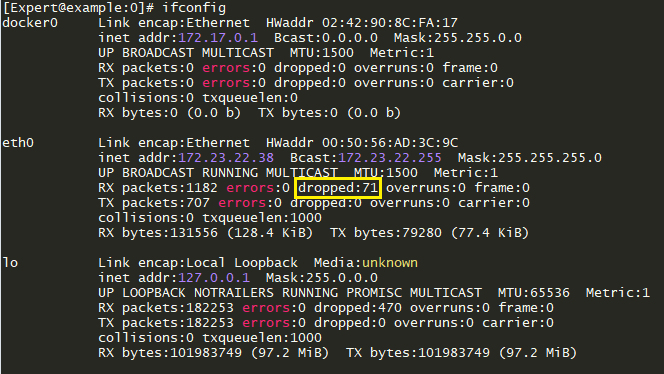
Output of the "
ifconfig" command on a Security Gateway R80.30 and higher with Gaia kernel 3.10 shows that the number "RX packets - dropped" on interfaces increases.Example:
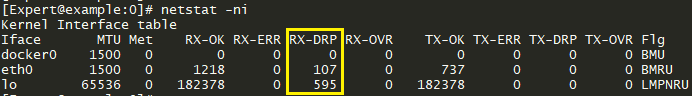
- Output of the "
netstat -ni" command on a Security Gateway R80.30 and higher with Gaia kernel 3.10 shows that the number "RX-DRP packets" on interfaces increases.Example:
There were no RX packet drops while in the same environment, the same Security Gateway was running R80.20 or lower versions with Gaia kernel 2.6.18.
Cause
Based on the expected Linux OS behavior, various commands in Gaia OS versions from R80.30 to R81 with kernel 3.10 may show RX packet drops on interfaces under these conditions:
- The softnet backlog is full
- Ethernet frames are received with bad VLAN tags
- Packets are received with unknown or unregistered protocols
- IPv6 packets are received while IPv6 is disabled in Gaia
To view the capability and the current values of your interface, you’ll need “ethtool”. Simply do the following command :
ethtool -g eth0This will output something like this :
Ring parameters for eth0:
Pre-set maximums:
RX: 4096
RX Mini: 0
RX Jumbo: 0
TX: 4096
Current hardware settings:
RX: 256
RX Mini: 0
RX Jumbo: 0
TX: 256
We can see here that both RX and TX values are set to 256 but the interface have the capability of 4096 bytes.
To increase the buffers, do the following :
ethtool -G eth0 rx 4096 tx 4096