Monday, February 29, 2016

IPv6


IPv6 - Checkpoint   ipv6 - Basic from Cisco  http://www.9tut.com/ipv6-tutorial

Internet has been growing extremely fast so the IPv4 addresses are quickly approaching complete depletion. Although many organizations already use Network Address Translators (NATs) to map multiple private address spaces to a single public IP address but they have to face with other problems from NAT (the use of the same private address, security…). Moreover, many other devices than PC & laptop are requiring an IP address to go to the Internet. To solve these problems in long-term, a new version of the IP protocol – version 6 (IPv6) was created and developed.
IPv6 was created by the Internet Engineering Task Force (IETF), a standards body, as a replacement to IPv4 in 1998. So what happened with IPv5? IP Version 5 was defined for experimental reasons and never was deployed.
While IPv4 uses 32 bits to address the IP (provides approximately 232 = 4,294,967,296 unique addresses – but in fact about 3.7 billion addresses are assignable because the IPv4 addressing system separates the addresses into classes and reserves addresses for multicasting, testing, and other specific uses), IPv6 uses up to 128 bits which provides 2128 addresses or approximately 3.4 * 1038 addresses. Well, maybe we should say it is extremely extremely extremely huge :)
IPv6 Address Types
Address TypeDescription
UnicastOne to One (Global, Link local, Site local)
+ An address destined for a single interface.
MulticastOne to Many
+ An address for a set of interfaces
+ Delivered to a group of interfaces identified by that address.
+ Replaces IPv4 “broadcast”
AnycastOne to Nearest (Allocated from Unicast)
+ Delivered to the closest interface as determined by the IGP
A single interface may be assigned multiple IPv6 addresses of any type (unicast, anycast, multicast)
IPv6 address format
Format:
x:x:x:x:x:x:x:x – where x is a 16 bits hexadecimal field and x represents four hexadecimal digits.
An example of IPv6: 
2001:0000:5723:0000:0000:D14E:DBCA:0764
There are:
+ 8 groups of 4 hexadecimal digits.
+ Each group represents 16 bits (4 hexa digits * 4 bit)
+ Separator is “:”
+ Hex digits are not case sensitive, so “DBCA” is same as “dbca” or “DBca”…
IPv6 (128-bit) address contains two parts:
+ The first 64-bits is known as the prefix. The prefix includes the network and subnet address. Because addresses are allocated based on physical location, the prefix also includes global routing information. The 64-bit prefix is often referred to as the global routing prefix.
+ The last 64-bits is the interface ID. This is the unique address assigned to an interface.
Note: Addresses are assigned to interfaces (network connections), not to the host. Each interface can have more than one IPv6 address.
Rules for abbreviating IPv6 Addresses:
+ Leading zeros in a field are optional
2001:0DA8:E800:0000:0260:3EFF:FE47:0001 can be written as
2001:DA8:E800:0:260:3EFF:FE47:1
+ Successive fields of 0 are represented as ::, but only once in an address:
2001:0DA8:E800:0000:0000:0000:0000:0001 -> 2001:DA8:E800::1
Other examples:
– FF02:0:0:0:0:0:0:1 => FF02::1
– 3FFE:0501:0008:0000:0260:97FF:FE40:EFAB = 3FFE:501:8:0:260:97FF:FE40:EFAB = 3FFE:501:8::260:97FF:FE40:EFAB
– 0:0:0:0:0:0:0:1 => ::1
– 0:0:0:0:0:0:0:0 => ::
IPv6 Addressing In Use
IPv6 uses the “/” notation to denote how many bits in the IPv6 address represent the subnet.
The full syntax of IPv6 is
ipv6-address/prefix-length
where
ipv6-address is the 128-bit IPv6 address
+ /prefix-length is a decimal value representing how many of the left most contiguous bits of the address comprise the prefix.
Let’s analyze an example:
2001:C:7:ABCD::1/64 is really
2001:000C:0007:ABCD:0000:0000:0000:0001/64
+ The first 64-bits 2001:000C:0007:ABCD is the address prefix
+ The last 64-bits 0000:0000:0000:0001 is the interface ID
+ /64 is the prefix length (/64 is well-known and also the prefix length in most cases)
In the next part, we will understand more about each prefix of an IPv6 address.

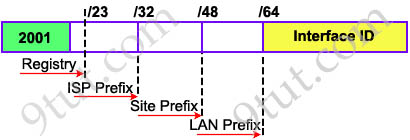
The Internet Corporation for Assigned Names and Numbers (ICANN) is responsible for the assignment of IPv6 addresses. ICANN assigns a range of IP addresses to Regional Internet Registry (RIR) organizations. The size of address range assigned to the RIR may vary but with a minimum prefix of /12 and belong to the following range: 2000::/12 to 200F:FFFF:FFFF:FFFF::/64.
ipv6_Address_Allocation_Policy.jpg
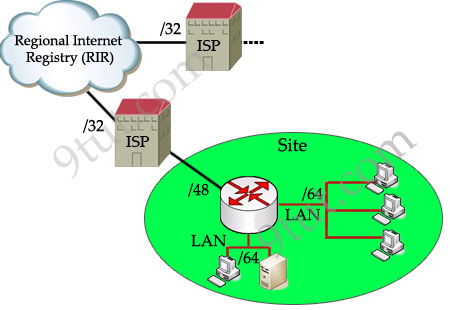
Each ISP receives a /32 and provides a /48 for each site-> every ISP can provide 2(48-32) = 65,536 site addresses (note: each network organized by a single entity is often called a site).
Each site provides /64 for each LAN -> each site can provide 2(64-48) = 65,536 LAN addresses for use in their private networks.
So each LAN can provide 264 interface addresses for hosts.
-> Global routing information is identified within the first 64-bit prefix.
Note: The number that represents the range of addresses is called a prefix
ipv6_policy_ISP.jpg
Now let’s see an example of IPv6 prefix: 2001:0A3C:5437:ABCD::/64:
IPv6_prefix_length_example.jpg
In this example, the RIR has been assigned a 12-bit prefix. The ISP has been assigned a 32-bit prefix and the site is assigned a 48-bit site ID. The next 16-bit is the subnet field and it can allow 216, or 65536 subnets. This number is redundant for largest corporations on the world!
The 64-bit left (which is not shown the above example) is the Interface ID or host part and it is much more bigger: 64 bits or 264 hosts per subnet! For example, from the prefix 2001:0A3C:5437:ABCD::/64 an administrator can assign an IPv6 address 2001:0A3C:5437:ABCD:218:34EF:AD34:98D to a host.
IPv6 Address Scopes
Address types have well-defined destination scopes:
IPv6 Address Scopes               Description
Link-local address+ only used for communications within the local subnetwork (automatic address configuration, neighbor discovery, router discovery, and by many routing protocols). It is only valid on the current subnet.
+ routers do not forward packets with link-local addresses.
+ are allocated with the FE80::/64 prefix -> can be easily recognized by the prefix FE80. Some books indicate the range of link-local address is FE80::/10, meaning the first 10 bits are fixed and link-local address can begin with FE80, FE90,FEA0 and FEB0 but in fact the next 54 bits are all 0s so you will only see the prefix FE80 for link-local address.
+ same as 169.254.x.x in IPv4, it is assigned when a DHCP server is unavailable and no static addresses have been assigned
+ is usually created dynamically using a link-local prefix of FE80::/10 and a 64-bit interface identifier (based on 48-bit MAC address).
Global unicast address+ unicast packets sent through the public Internet
+ globally unique throughout the Internet
+ starts with a 2000::/3 prefix (this means any address beginning with 2 or 3). But in the future global unicast address might not have this limitation
Site-local address+ allows devices in the same organization, or site, to exchange data.
+ starts with the prefix FEC0::/10. They are analogous to IPv4’s private address classes.
+ Maybe you will be surprised because Site-local addresses are no longer supported (deprecated) by RFC 3879 so maybe you will not see it in the future.

All nodes must have at least one link-local address, although each interface can have multiple addresses.
However, using them would also mean that NAT would be required and addresses would again not be end-to-end.
Site-local addresses are no longer supported (deprecated) by RFC 3879.
Special IPv6 Addresses
Reserved Multicast AddressDescription
FF02::1+ All nodes on a link (link-local scope).
FF02::2+ All routers on a link
FF02::5+ OSPFv3 All SPF routers
FF02::6+ OSPFv3 All DR routers
FF02::9+ All routing information protocol (RIP) routers on a link
FF02::A+ EIGRP routers
FF02::1:FFxx:xxxx+ All solicited-node multicast addresses used for host auto-configuration and neighbor discovery (similar to ARP in IPv4)
+ The xx:xxxx is the far right 24 bits of the corresponding unicast or anycast address of the node
FF05::101+ All Network Time Protocol (NTP) servers
Reserved IPv6 Multicast Addresses
Reserved Multicast AddressDescription
FF02::1+ All nodes on a link (link-local scope).
FF02::2+ All routers on a link
FF02::9+ All routing information protocol (RIP) routers on a link
FF02::1:FFxx:xxxx+ All solicited-node multicast addresses used for host auto-configuration and neighbor discovery (similar to ARP in IPv4)
+ The xx:xxxx is the far right 24 bits of the corresponding unicast or anycast address of the node
FF05::101+ All Network Time Protocol (NTP) servers

Monday, February 22, 2016

Troubleshooting-Hardware

Hardware/Interface/ARP/Routing/Connections/CPU/RAM


cat /proc/cpuinfo | egrep "MHz|model name"
cat /proc/meminfo | grep MemTotal
 /usr/sbin/dmidecode | grep "Product Name"


dmidecode | egrep -i "serial|product"
clish -c "show asset all"
clish -c "show sysenv all"
(same as cisco show env)

For the CPU details use cat /proc/cpuinfo
For the RAM details use cat /proc/meminfo | grep MemTotal

The output of the dmesg command and the /var/log/ should examined for hardware errors
and Critical error messages and logs    can be also very helpful

Example of errors in var/log/messages  :
wd0: interrupt timeout:
wd0: status 58<seekdone,drq> error 0


HOW DO I SHUT AND UNSHUT AN INTERFACE
#ifconfig <interface name > down
#ifconfig <interface name > up

netstat -i
more /etc/sysconfig/hwconf | grep eth* | grep -v detached 
(to find mac)
cpstat os -f ifconfig  ( interface ip /mac/mtu/description)
ifconfig -a  (ifconfig eth4)
cphaprob -a if (only for claster)
fw ctl iflist   (which lists just the interface names and number ,used for some fwmonitor cap)
fw getifs    (summary display of IP addresses per interface)
ethtool -S eth0  (to see errors on interface )
ip add show
clish -c "show interface eth1"
clish -c "show configuration interface"
NOTE:you can monitor for errors on interface using watch command 
watch -n 1 "netstat -i"

by default it is 2 sec and with -n you can specify time 
watch -n 0.1 "cphaprob -a if"
watch -n 1 " ethtool -S eth1 | grep errors "


To check speed and duplex on all interfaces script:
for ii in $(ifconfig | awk ' /Ethernet/ {print $1}') ;do ethtool $ii; done | egrep  'eth|Speed|Duplex'

To see 4 top talkers on interface (in this case eth0)
tcpdump -tnn -c 20000 -i eth1 | awk -F "." '{print $1"."$2"."$3"."$4}' | sort | uniq -c | sort -nr | awk ' $1 > 100 '

fw monitor -e “bad_nets = static {<194.1.0.0,194.1.255.255>} ;accept src in bad_nets and ifid=0;” (ifid ve can see in (fw ctl iflist ) command)
packets originated in range of networks 194.1.0.0 – 194.1.255.255 and captured on interface eth3 only


Test ARP
arping -I eth1 1.1.1.1  (def is eth0)
arping -s <source ip> 10.0.01  (in case you have multiple ip on interface )

arp -an | wc -l   or   arp -av | grep Entries  (to see number of arp )
arp -i eth6   (to see all arp on eth6)
cd /proc/net/arp
clish -c "show configuration arp"
clish -c "show arp table cache-size"  (Default: 1024, Range: 1024-16384)
clish -c "show arp static all"
clish -c "show arp dynamic all" | grep 1.1.1.1
clish -c "show arp proxy all"
ip neigh show

Flush arp entry for host 10.20.30.40
arp -d 10.20.30.40

Flush all arp enties on interface eth0:
ip neigh flush dev eth0

Flush arp entry for host 10.20.30.40:
ip neigh flush 10.20.30.40

Flush arp entry for all hosts in network 192.168.0.0/24
ip neigh flush 192.168.0.0/24

Clear all arp table
clish
delete arp dynamic all

To check is any manual proxy arp configured :
$FWDIR/conf/local.arp

To change arp config :
clish
set arp table cache-size VALUE


Troubleshoot Gaia Routing
General Commands:

ip route show to match x.x.x.x
ip route get x.x.x.x
clish -c"show route destination  x.x.x.x "
show route (in iclid shell)
netstat -rn | grep x.x.x.x
netstat -rn | wc -l (number of routes)
cpstat os -f routing
clish -c "show configuration ospf"
clish -c "show configuration static-route"


Add route
set static-route VALUE nexthop blackhole
set static-route VALUE nexthop gateway address VALUE off
set static-route VALUE nexthop gateway address VALUE on
set static-route VALUE nexthop reject
set static-route VALUE off


Restart Routing Process
ps auxw | grep -v grep | grep -E "PID|routed" (to see is process running)
drouter stop && drouter start
drouter start           -       Start Dynamic Routing daemon
drouter stop            -      Stop Dynamic Routing daemon

tellpm process:routed t    (start routing process)    (survives reboot)
tellpm process:routed     (stop routing process)    (survives reboot)


cat /proc/cpuinfo
cpstat -f cpu os
cpstat -f multi_cpu os
cpstat os -f perf
ps auxwf
vmstat 2 5
top

Note: This shows drops due to the CPU not being able to cope
watch -n 1 "ethtool -S eth1 | grep rx_no_buffer_count 


 top explanation

%us:Time spent running non-kernel code (User)
%sy: Time spent running kernel code (System)
%ni: Nice time
%id: Time spent idle
%wa: Time spent waiting for IO
%hi: hardware interrupt
%si: Software interrupt
%st: stealth time (Involuntary wait time)

RES (or RSS) For high memory consumption of specific process (for example –fwm)
It is possible also to sort this output, as follows:
Pressing:‘M’ (ctll+M)
sorts the output based on the memory usage (RSS column)
‘P’
sorts the output based on the CPU usage (%CPU column)

The idle value (%id) shows how busy the appliance is.
If the value is 0, the CPU is maxed out. With the
firewall under load, examine the output of idle column (%id) for each CPU and determine if core usage is spread out evenly

High CPU in user time(%us)
indicates that some daemon processis consuming high CPU;
security server processes like fwssd and in.ahttpd have been offenders in the past. (Figure out
which process it is from the output of ps or top)

High CPU usage in system(%sy)
indicates that the Check Point kernel (traffic being inspected by Check Point or SmartDefense) is consuming CPU. Certain configurations in SmartDefense and web-Intelligence can cause this to occur by disabling SecureXL templating or completely disabling SecureXL acceleration.

High CPU in wait time(%wa)
occurs when the CPU was idle due to the system waiting for an outstanding disk I/O requestto complete.This indicates your system is probably low on physical memory and is swapping out memory(paging)*
The CPU is not actually busy if this number is spiking; the CPU is blocked from doing any useful work waiting for an I/O event to complete.The occurrence of paging can be determined by running vmstat -n 5 5 and checking the swapped in (si) and swapped out(so) statistics. Disregard the first line as it is an average value since the appliance started.

A high value against software interrupt (%si)ndicates that there is probably a high load of traffic on the appliance.The interface errors (netstat –i) should be examined to see if this is a cause of concern.


vmstat expanation

how to time stamp vmstat ?
vmstat 1 |awk '{now=strftime("%Y-%m-%d %T "); print now $0}'

Note:First line is system average since it is started so we can ignore 

The ‘procs’ field has 3 columns:
r – The number of processes waiting for run time( task/threads that waiting  in line to get cpu)
task==>task==>CPU1   task==>CPU2   in this case we have 3  threads waiting
so this is in general indicator  of work ask of  CPU and how busy it is
average load of cpu  is track with command uptime  and we can see load average numbers over 1 , 5 and 15 min or in other words  how many threads are running or wanting to run on CPU, averaged over time intervals.
b – The number of processes in uninterruptible sleep (blocked processes/not useful :( )
w – This number is how many threads are moved form RAM(because it is too busy) moved to swap
/virtual memory .

The ‘memory’ field has 4 columns: (see with vmstat -a)
swpd – The amount of used swap space(virtual memory)
free – The amount of idle memory(free RAM/Real memory).
inact – The amount of inactive memory.
active – The amount of active memory.
******************************************************
The ‘swap’ field has 2 columns:
si – Amount of memory swapped in from disk (/sec).
so – Amount of memory swapped to disk (/sec).
******************************************************
The ‘io’ field has 2 columns:
bi – Blocks received from a block device (blocks in).
bo – Blocks sent to a block device (blocks out).
******************************************************
The ‘system’ field has 2 columns:
in – The number of interrupts per second, including the clock (System interrupts).
cs – The number of context switches per second (Process context switches).
******************************************************
The ‘cpu’ field has only 4 columns:
us: Time spent running non-kernel code. (aplications and process used bu user).
sy: Time spent running kernel code. (system time,also time spend serving interrupts).
id: Time spent idle.
wa: Time spent waiting for IO.
******************************************************
CPU Problem:
 if r has numbers in it constantly, threads/tasks waiting to be processed by your  cpu
if in is high, you are handling too many interrupts (likely from disk activity, but could be bad driver)
Processes Problem:
us or sy is high? Some process is being a cpu hog, use top to find it, and kill -9 the PID if needed

Disk Subsystem Overloaded:
wa is high? If you are waiting for IO then you need to upgrade your disk subsystem

Not Enough RAM:
 si and so are high, swapping disk too much. You really shouldn’t swap at all for high performance. If these are high, in will be high too. Upgrade your RAM.

Low Memory:
cs is high? The kernel is paging memory in and out of context. Likely you need more RAM,

Out of Memory:
I ignore free, inact, active because it’s not as useful and understanding the actual reasons.  if you are out of memory, you’ll know that, but unless you look at cs, so, si, etc you won’t know why. So it’s redundant.

Use option -a, to display active and inactive memory information
Use option -m to see memory details
Use option -s to displays the values in the record format

 ******************************************************
free is a command which can give us valuable information on available RAM
free -k -t
-k, --kb Display output in kilobytes (KB). This is the default.
-m, --mb Display output in megabytes (MB).
-g, --gb Display output in gigabytes (GB).
-t, --total Display total summary for physical memory + swap space.
Watch real time changes evey 5 sec
watch -n 5 free -m
******************************************************
Note:SWAP mem is same concept as virtual memory in Windows
The „total? column shows the amount of RAM installed in the system
and the amount of disk space allocated for swap space
The amount of swap space is normally automatically set to twice the size of the physical memory
The „used? column indicates how much RAM and swap space are being used.
The „free? column indicates how much RAM and swap space are available.
If for some reason the amount of free RAM becomes low, the appliance will start to preserve free RAM by swapping out the contents of the memory to the hard disk (swap space).
******************************************************
EXPLANATION OF OUTPUT 
******************************************************
Output:
total used free shared buffers cached
Mem: 8027952 4377300 3650652 0 103648 1630364
-/+ buffers/cache: 2643288 5384664
Swap: 15624188 608948 15015240
******************************************************
Explanation:
Line 1: Indicates Memory details like total available RAM, used RAM, Shared RAM, RAM used for buffers, RAM used of caching content.
Line 2: Indicates total buffers/Cache used and free.
Line 3: Indicates total swap memory available, used swap and free swap memory size available.
******************************************************
Line 1:
Mem: 8027952 4377300 3650652 0 103648 1630364
8027952 : Indicates memory/physical RAM available for your machine. These numbers are in KB's
4377300 : Indicates memory/RAM used by system. This include even buffers and cached data size as well.
3650652 : Indicates Total RAM free and available for new process to run.
0 :  Indicates shared memory. This column is obsolete and may be removed in future releases of free.
103648 : Indicates total RAM buffered by different applications in Linux
1630364 : Indicates total RAM used for Caching of data for future purpose.
******************************************************
Line 2:
2643288 : This is actual size of used RAM which we get from RAM used -(buffers + cache)
A bit of mathematical calculation
Used RAM = +4377300
Used Buffers = -103648
Used Cache = -1630364
Actual Total used RAM is 4377300 -(103648+1630364)= 2643288
So we can see this in second colum
-/+ buffers/cache: 2643288 5384664
5384664 : Indicates actual total RAM available, we get to this number by subtracting actual RAM used from total RAM available in the system.
Total RAM = +8027952
actual used RAM = -2643288
Total actual available RAM = 5384664
******************************************************
Line 3:
Swap: 15624188 608948 15015240
This line indicates swap details like total SWAP size, used as well as free SWAP.
Swap is a virtual memory created on HDD to increase RAM size virtually.
******************************************************
Too see how much ram is free to use for your applications, run free -m and look at the row that says "-/+ buffers/cache" in the column that says "free". That is your answer in megabytes:
$ free -m
                    total       used       free     shared    buffers     cached
Mem:          1504       1491         13          0         91        764
-/+ buffers/cache:        635        869
Swap:         2047          6       2041

you'll think the ram is 99% full when it's really just 42%. (because in colume used is 1491 so it is misguiding)
******************************************************


Wednesday, February 17, 2016

Types_of_Firewalls


Quick Reference: Check Point

Check Point Software

Check Point Firewall-1


Useful Firewall-1 command line utilities:

Unload current security policy
fw unloadlocal
VPN Tunnel command line access (e.g. delete SAs)
vpn tu
Display overlapping VPN Encryption Domains
vpn overlap_encdom [communities|traditional]
List current Firewall interfaces
fw ctl iflist
Show HA / ClusterXL state
cpstat ha
cphaprob state
cphastop / cphastart
Display State of Checkpoint HA Interfaces
cphaprob -a if
Stop/Start Checkpoint HA/ClusterXL
cphastop / cphastart
Display State of Checkpoint HA Interfaces
cphaprob -a if
Manually failover
cphaprob -d STOP -s problem -t 0 register
cphaprob list
cphaprob -d STOP unregister
Display State of ClusterXL IGMP
cphaprob stat   (Notify if IGMP membership is supported)
cphaprob igmp    (Display the current IGMP membership settings)

SmartCenter

Backup and Restore SmartCenter
upgrade_export
$FWDIR/bin/upgrade_tools/upgrade_import
Check whether licensed for management high availability (Management HA)
cplic check mgmtha

SecurePlatform

SecurePlatform configuration commands:
Configure Interfaces, Routes etc
sysconfig
Add static routes
config route add dest 192.168.1.0/24 via 192.168.0.1 dev eth0 metric 0 s-persistant on apply on
Configure Network Interfaces
config conn help
config conn set name eth1 type eth onboot on iff-up on local 192.168.1.2/24 broadcast 192.168.1.255 s-persistant on s-code up mtu 1500
Configure Bonded Network Interfaces (NIC Team, 2 physical, 1 logical interface)
config conn add name bond0 type bond onboot on iff-up on mtu 1500 bond-mode active-backup bond-miimon 100 bond-downdelay 200 bond-updelay 200 bond-primary eth1 local 192.168.1.2/24
config conn add name eth1 type eth onboot on iff-up on mtu 1500 master-bond bond0
config conn add name eth4 type eth onboot on iff-up on mtu 1500 master-bond bond0
Useful SecurePlatform command line utilities:
Enter OS commands
expert
Assign interfaces to correct physical NICs
(Edit /etc/sysconfig/ethtab)
[Expert@FIREWALL]# cat ethtab
eth0 00:21:5A:27:DC:E6
eth1 00:21:5A:27:DC:E4
eth2 00:1F:29:5C:82:F5
Set Kernel parameters
(Edit $FWDIR/boot/modules/fwkern.conf)
fwha_mac_magic=0x11
fwha_mac_forward_magic=0x10
fwha_monitor_if_link_state=1
fwha_enable_igmp_snooping=1
fwha_igmp_version=2
Flag disconnected NICs
echo eth6 >> $FWDIR/conf/discntd.if
Show status of Bonded Network Interfaces
cphaconf show_bond -a
Display Versions
SPLAT: ver
Firewall: fw ver
Performance Pack: sim ver –k
Linux: uname -a
Change shell to permit WinSCP connection
usermod -s /bin/bash fwadmin
Change shell timout (cpshell)
idle mm where mm = timeout in minutes (permanent change, updates /etc/cpshell/cpshell.state and is passed on to expert shell)
Change shell timout (bash)
TMOUT = ss where ss = timeout in minutes
export TMOUT
Display the number of CPUs presented to SecurePlatform OS
grep ‘physical id’ /proc/cpuinfo|wc -l
Display the CoreXL CPU Affinity
fw ctl affinity -l
Advanced Routing (gated) Commands
ps -eaf | grep gated
cpwd_admin list
Check Point Troubleshooting & Debugging Tools:


Useful Checkpoint commands

Posted on November 25, 2010
2


15 Votes

Checkpoint is not a cli based firewall, the cli is generally (in the daily life) not used. What the admin wants, can do through the GUI. For troubleshooting purposes or just query something there are some useful commands. In this list I tried to collect what I already had to use (or wanted to try out).
Table 1.
General checkpoint, IPSO commandsDescription
ipsctl hw:eeprom:product_idShow Product Id. on IPSO
ipsctl hw:eeprom:serial_numberShow Serial No. on IPSO
uname -aShow IPSO Version
ipsofwd listshow forwarding option on IPSO
[admin]# ipsofwd list
net:ip:forward:noforwarding = 0
net:ip:forward:noforwarding_author = fwstart
net:ip:forward:switch_mode = flowpath
net:ip:forwarding = 1
example for forwarding options
ipsofwd on usernameset forwarding on if firewall stopped
ipsctl -w net:log:partner:status:debug 1enable interface debugging (sk41089)
ipsctl -w net:log:sink:console 0disable debugging
Table 2.
Firewall Commands
fw verShow Firewall Version
vpn macutilGenerate MAC Address for users. This can be used to fix an IP in DHCP Server.
cpstat polsrv -f allShow the connected and the licensed users
cpstat fw -f http, ftp, telnet, rlogin, smtp, pop3Check protocol states.
fw statShow policy name and the interfaces that have already seen any traffic.
fw stat -longShows the policy and the stats for the policy
cpstat os -f cpu -o 3Monitor CPU state every 3 seconds
-o Polling interval (seconds) specifies the pace of the results. Default is 0, meaning the results are shown only once.
-c Specifying how many times the results are shown. Default is 0, meaning the results are repeatedly shown.
cpstat useful parameters
cpstat osShow SVN Foundation and OS Version
cpstat fw -f allProduct, Policy und Status informations
cpstat fw -f policyShow Installed Policy name
fw tab -t connections -sShow active connections
fw fetchInstall Policy from MGM server
cplic printPrint licenses
fwha_mac_magicConnecting multiple clusters to the same network segment (same VLAN, same switch) – sk25977
cp_conf sic state
SIC test on the firewall
cp_conf sic init <Activation Key> [norestart]
SIC reset on the firewall
fw ctl zdebug drop | grep 1.1.1.1
check dropped packets on the firewall for host 1.1.1.1
Table 3.
Sniffer on the Firewall
fw monitor -m iIoO -e “accept (src=IP_S and dst=_IP_D) or (src=IP_D and dst=IP_S);”Monitor traffic between host with IP IP_S and host with IP IP_D
fw monitor -m iIoO -e “accept (src=IP_S and dst=_IP_D) or (src=IP_D and dst=IP_S);” -owmonitor_cat.capnot just monitor but save as capture to a file
fw monitor -m iIoO -e “accept (src=IP_S and dst=_IP_D) or (src=IP_D and dst=IP_S);” -p all -a -oDatei.capnot just monitor but save capture to a file + deeper debug
fw monitor -m iIoO -e “accept (sport=5200 or sport=5100 or sport=5000);”Monitor traffic on the source port 5200, 5100 or 5000
Table 4.
Remote Access and S2S VPN commands
vpn tuvpn tunnel util, for VPN checking, delete
fw tab -t inbound_SPI -fList SPI and users (external IP, office mode IP, username, DN of a user in case of certificate auth)
fw tab -t om_assigned_ips -fList users and assigned Office mode IPs
fw tab -t marcipan_ippool_users -fList Office Mode used IPs
fw tab -t om_assigned_ips -f -m 2000 | awk ‘{print $7,$11}’ | grep -v ‘^ ‘Lists office mode Ip fore 2000 users (use -u for unlimited number)
fw tab -t marcipan_ippool_users -xused to manually clear the Office Mode connections table on the Gateway
vpn debug truncinitiates both vpn debug and ike debug
vpn debug on TDERROR_ALL_ALL=5initiates vpn debug on the level of detail provided by TDERROR_ALL_ALL=5. Output file is $FWDIR/log/vpnd.elg
vpn debug ikeoninitiates vpn ike debug. Output file is $FWDIR/log/ike.elg
vpn debug monWrites ike traffic unecrypted to a file. The output file isikemonitor.snoop. In this output file, all the IKE payloads are in clear
vpn debug ikeoffStops ike debug. Get ikeviewer to check the ike traffic and log.
vpn debug offStops vpn debug
vpn debug moffStops ike sniffer
vpn export_12 -obj <objectname> -cert <certificatename> 
-file <filename> -passwd <passw> 
Example:
vpn export_p12 -obj Office_GW -cert defaultCert
–file office_cert.p12 -passwd mypassword
export a certificate using the Security Management server. certificate object is the Certificakte Nickname from the GUI.
Table 5.
Clustering commands
cphaprob listShow processes monitored by HA
cpstat fw -f syncShow counters for sync traffic
cphaprob stateShow cluster mode and status
cpstat ha -f allShow HA process and HA IP status
fw ctl pstatShow memory, kernel stacks, connections, fragments,…, SYNC status
cphaprob -a ifShow Sync interface(s) and HA IP(s)
cphaprob syncstatShow Sync statistics
fw hastatShow HA stat ONLY by ClusterXL! not with VRRP
Table 6.
General commands
ps -auxReport all active processes in the kernel IPSO
kill -9 prozessidStop a process
dmesgshow boot logs
vmstat 5 5show memory, cpu usage
ifconfig bge1:xx downset virtual Interface on Provider1 down
fsckFilsystemcheck
Table 7.
Administrate CMA/MDS processes
mdsstop_customerStop a CMA
mdsstart_customerStart a CMA
mdsstatShows MDS and CMA Status
mdsstopStops all CMAs und Server processes
mdsstartStart all CMAs und Server processes
mdsenv CMANAMEChange the Enviroment to selected CMA
echo $FWDIRThis displays the correct path for the CMA.
cpstat mgcheck the connected clients (with Provider1 in the CMA Level: mdsenv <CMA-IP>)
fwm -aChange admin password (or cpconfig delete admin and add admin)
fwm dbloadInstall database
watch -d “cpstat os -f cpu”Monitor cpu state with watch
Table 8.
Searching for objectsWhat you cannot find whit cross CMA search
cd $FWDIR/conf
grep subdomain objects.C | grep -v Name | awk ‘{print $2}’ | grep “^(” | sed -e ‘s/(//’
Searching all objects with subdomain ‘subdomain’ in their name
cd $FWDIR/conf
grep subdomain /opt/CPmds-R65/customers/*/CPsuite-R65/fw1/conf/objects.C | grep -v Name | awk ‘{print $1, $3}’ | grep “(” | sed -e ‘s/(//’
Searching all objects in all firewalls (in MDS) with subdomain ‘subdomain’ in their name
grep “2.2.2.2\|3.3.3.3” /opt/CPmds-R65/customers/*/CPsuite-R65/fw1/conf/objects_5_0.Cfind the 2 IP Address in the firewall configs
grep hostimiss.com /opt/CPmds-R65/customers/*/CPsuite-R65/fw1/conf/rulebases_5_0.fwsfind the hostname in the firewall rulebase configs
Table 9.
Archive commands
tar tfv [ARCHIVNAME].tarShow the content of an archive
tar cfvz [ARCHIVNAME].tar.gz[VERZEICHNIS1] [DATEI1]Archive files
tar xfvz [ARCHIVNAME].tar.gzopen archive
SCP command
scp root@provider1:/opt/CPmds-R65/customers/cma1/CPsuite-R65/fw1/conf/objects_5_0.C .copy the objects_5_0.C file to the lokal folder from where the command was issued
Collect info for Checkpoint TAC
cpinfo [-v] [-l] [-n] [-o ] [-r | -t [tablename]] [-c cma … | -x vs]* -z: Output gzipped (effective with -o option).
* -r: Includes the registry (Windows – very large output).
* -v: Prints version information.
* -l: Embeds log records (very large output).
* -n: Does not resolve network addresses (faster)
* -t: Output consists of tables only (SR only).
* -c: Get information about the specified CMA (Provider-1).
* -x: Get information about the specified VS (VSX).
And some example for cpinfo.
CPinfo Options:
cpinfo [-v] [-l] [-n] [-o output_file] [-r | -t [tablename]] [-c cma/ctx]-o output_file (Redirect output into file output_file)
-r (Include the registry in the output)
-v (Print version information)
-l (Embed Log records)
-n (Do not resolve network addresses)
-t (Output consists of tables only (SR only)
-c (Get information about the specified cma/ctx)
(No parameters): Redirects output to the standard output (the command window).Required steps to get the cpinfo from mds:1. Back to MDS
mdsenv
2. Verify the correct environment
echo $FWDIR
/opt/CPmds-R65/
3. Run cpinfo
cpinfo -z -n -o /var/mds.cpinfoRequired steps for cpinfo from the relevant CMA (sk10176)1. List of all Customers (CMAs)
mdsstat
2. Set the environment for the Customer
mdsenv CMANAME
3. Verify the correct environment
echo $FWDIR
/opt/CPmds-R65/customers//CPsuite-R65/fw1/
4. Run cpinfo
cpinfo -c CMANAME -z -n -o FILENAME
Checkpoint logging in short.
VPN-1/FireWall-1 NG includes the following log type files:- FWDIR/log/xx.log – stores the log records.
– FWDIR/log/xx.logptr – provides pointers to the beginning of each log record.
– FWDIR/log/xx.loginitial_ptr – provides pointers to the beginning of each log chain (logs that share the same connection ID – LUUID).
– FWDIR/log/xx.logaccount_ptr – provides pointers to the beginning of each accounting record.
– Note: the NG log directory also includes an additional temporary pointer file, namedxx.logLuuidDB.To purge/delete the current log files without saving it to a backup file, run:
# fw logswitch “”The VPN-1/FireWall-1 NG audit log type files are:- xx.adtlog – stores the audit log records.
– xx.adtlogptr – provides pointers to the beginning of each log records.
– xx.adtloginitial_ptr – provides pointers to the beginning of each log chain (logs that shared the same connection ID – LUUID).
– xx.adtlogaccount_ptr – provides pointers to the beginning of each accounting record.Topurge/delete the current audit log files without saving it to a backup file, run:
fw logswitch -audit “”
This is an example how to collect the same info (the fw version here) from all of our firewall with a script.
We need to collect the firewalls with their IPs or with their hostnames in a file I call iplist and run the srcipt with ‘sh ./get_fwversion.sh
root@myserver # cat get_fwversion.sh
#!/bin/bash
for HOST in $(cat iplist | grep -v "^#" | grep -v "^$")
do
echo $HOST
ssh admin@$HOST 'fw ver'
# Some example. Just delete the # for the required command
# ssh admin@$HOST 'ipsctl hw:eeprom:product_id'
# ssh admin@$HOST 'fwaccel stat'
# ssh admin@$HOST 'clish -c "show vrrp"'
# ssh admin@$HOST 'grep buffer /var/log/messages' | tail -n 2
# ssh admin@$HOST 'grep "Log buffer is full\|log/trap messages" /var/log/messages'
# ssh admin@$HOST 'cpstat os -f cpu'
done
root@myserver # cat iplist
#R55
myfirewall1
myfirewall2
myfirewall3
myfirewall4
myfirewallcluster1_A
myfirewallcluster1_B
#R60
myfirewall5
myfirewall6
#R65
myfirewall7
myfirewall8
myfirewallcluster2_A
myfirewallcluster2_B
Important Files:
On the Management Server:
$FWDIR/conf/classes.C – scheme file. Each object in objects.c, rulebases.fwsfwauth.ndb or whatever must match one of the classes listed below.
$FWDIR/conf/objects_5_0.C – object file.
$FWDIR/conf/rulebases_5_0.fws – Rulebase file.
$FWDIR/conf/fwauth.NDB – userdatabase
$FWDIR/conf/.W – The policy file
$FWDIR/conf/user.def.NGX_FLO – User defined inspect code (sk30919)
On the Firewall:
$FWDIR/conf/masters – On the firewalls shows who is the management server
$FWDIR/conf/initial_module.pf – Initial Policy of the firewall
$FWDIR/conf/discntd.if – Add the interface-name in this file to disable monitoring in Secureplatform